
In the XlineSoft Forum and emails I have received, there are users who want a graph on each line to be provided on the LIST page.
I have taken this example to explain how it can be done with the AnyChart Plugin.
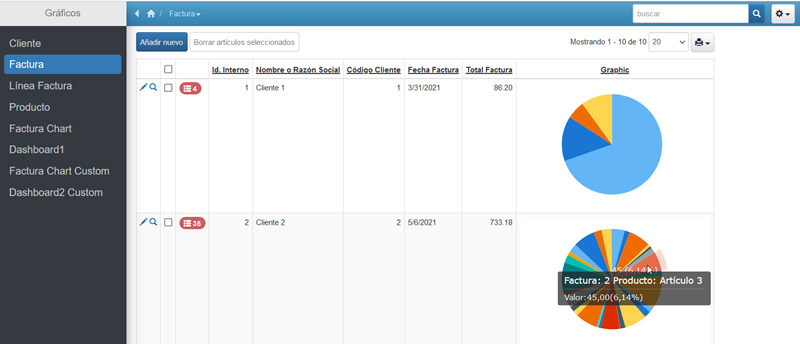
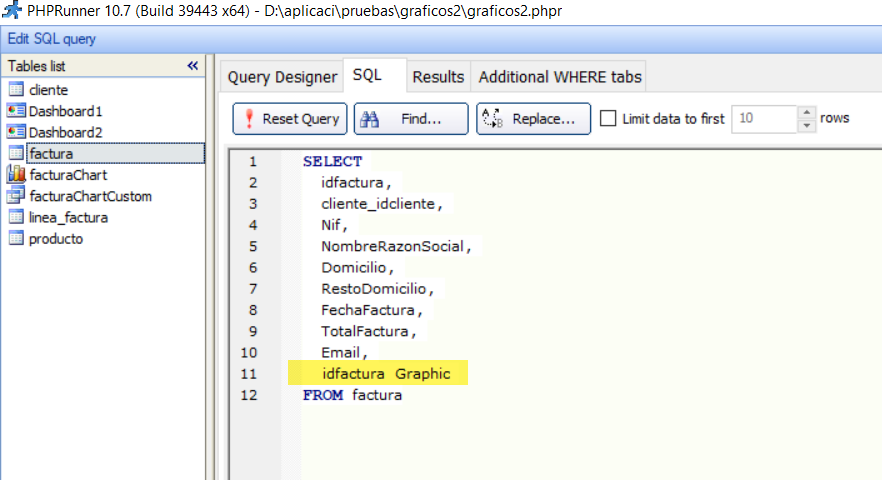
This new field of the “Invoice” table is a duplicate of the “idfactura” and we will use it with the plugin to create the graphics.
And the code written to produce the chart is in the file ( anychart_3.php ):
<?php
/*
Variables passed by the Plugin:

$field_value .- Field what show screen
$DataValue .- Valor del campo que se utiliza en el plugin
$javascript .- File of Javascript of Anychart
$theme .- File of Theme of Anychart
$language .- File Javscript of language
$decimalsCount .- Parameter
$zeroFillDecimals .- Parameter
$decimalPoint .- Parameter
$groupsSeparator .- Parameter
$license .- License of ANYCHART for PHPRunner
$id_field .- Field occurrence identification number used to identify the "container".
*/

global $conn;

$chartData='';

$idfactura = $DataValue;

$strSQLExists = "SELECT
factura.idfactura, factura.Nif, factura.NombreRazonSocial, factura.FechaFactura, factura.TotalFactura,
linea_factura.idlinea_factura, linea_factura.factura_idfactura, linea_factura.producto_idproducto, linea_factura.Nombre, linea_factura.Valor
FROM factura
left join linea_factura on (factura.idfactura = linea_factura.factura_idfactura)
WHERE idfactura = $idfactura ";

$rsExists = db_query($strSQLExists,$conn);

 while ($Row = db_fetch_array($rsExists)) {
 $idFactura='Factura: '.$Row["idfactura"].' Producto: '.$Row["Nombre"];
 $TotalValor=$Row["Valor"];
 $FechaFactura=$Row["FechaFactura"];
 $chartData.="['$idFactura', $TotalValor, $FechaFactura] \n,";
 }
$chartData = substr($chartData, 0, -1);

$graphicDefinition= <<<EOT

// create pie chart with passed data
var data = anychart.data.set([
// add data of the Client
 $chartData
 ]);

var wealth = data.mapAs({'x': 0, 'value': 1});

var chart = anychart.pie(wealth);

// License, out logo
$license

// apply coffee theme
// anychart.theme(anychart.themes.coffee);

// turn on chart animation
chart.animation(true);

// set chart title text settings
chart.title('Facturas del Cliente');
// Special
chart.title().enabled(false);
// Tooltip
var tooltip = chart.tooltip();
tooltip.titleFormat("{%x}");

tooltip.format("Valor:{%value}{groupsSeparator:.,decimalPoint:\\\\,,decimalsCount:2}({%yPercentOfTotal}{decimalPoint:\\\\,,decimalsCount:2}%)");

// URL Format in: https://docs.anychart.com/Common_Settings/Text_Formatters

chart.labels().format('{%Value}{decimalsCount:0} ({%yPercentOfTotal}{decimalsCount:2}%)');

// set legend title text settings
var legend = chart.legend();
// set legend position and items layout
legend.position("center");
legend.align("Bottom");
legend.fontSize(10);
legend.itemsLayout("vertical");

// Special
legend.enabled(false);

// set container id for the chart
chart.container('container_$id_field');
// initiate chart drawing
chart.draw();
});
</script>
EOT;

$field_value .= $graphicDefinition;
?>
The new version is executed in PHPRunner 10.7
If you are interested in this article, continue reading it at this link .
 fhumanes author