I am using phpRunner 10.91 build 41242. I have been using phprunner since around 2008. In this situation, I have a list page with any number of transactions records shown. Each record has a TRX DATE and a TRX AMT. The records on this list page(s) are based on various searches and filters that the user has performed - eg: often by date range(s) and TRX types/categories etc. In any case, I simply want to have a way to chart the transactions listed in this list page(s) result set. It may be a few or it may be many thousands across many pages. I want my chart to show TOTAL TRXS and TOTAL AMOUNTS BY DATE so the user can see the profile of the TRXs over whatever the time period that the TRXs span.
I have charts like this from existing summary tables I have pre-built already. I have done extensive JS chart modifications with multiple axis and clickable points and range selections etc. The anychart stuff is excellent! People LOVE the interactivity of them! But in this case, the chart needs to be driven from the CURRENT RESULT SET within the CURRENT LIST page(s). For some reason (programmers block) I just do not see how to make this happen?!?!?!?!?! The data going into the chart is a count of TRXS and SUM(TRX_AMT) by TRX_DATE.
Ideally, I would like to have a button that allows the user to chart the data when they are ready as the full DB holds many many millions of TRXS and they would want to reduce the TRXs to the ones that they want to chart before the chart runs. If I really could have my dream functionality, I would like to think of it as (today), doing something like print or export (CHART) all or selected rows from the grid.
I also tried putting the grid into a dashboard with the chart as a detail with a relationship - but all I get is when I click on any TRX, it charts that ONE single TRX record - which makes a useless chart. I want the chart to show me the summation of the entire current LIST of TRXS. I think I am missing how the data is collected and sent into a defined chart. What connects the list page dataset to the chart? Am I supposed to write code to collect the data (TRXDATE and TRXAMT) from the pages (or possibly selected items on the pages) and then make my own chart from scratch by myself? I would like to use a phpr defined chart but that does not seem to make sense to me as that expects data from a table. All I have to work with is the current result set on the list page(s).
Oh, ALL web users of this database have strictly READ-ONLY access to the DB (sqlite at approx 95GB size) - so there is no creating a temp table etc.
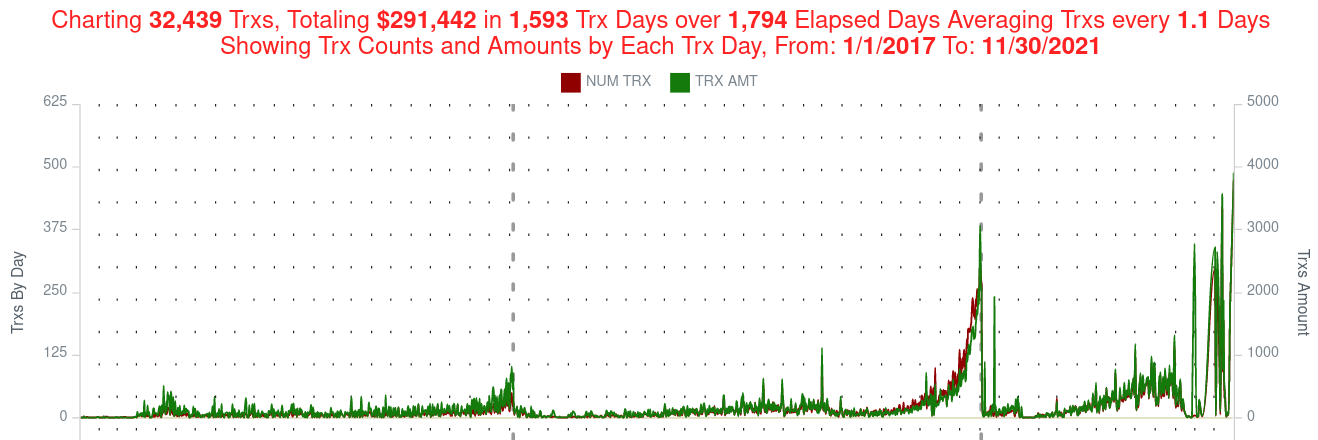
I have included a sample charts I have already done. I want to make the same thing but the data that drives the page comes from on-the-fly contents of the list page current data set. I hope the image in this posting shows as I hope it will. This seems like something many might like to have.
MANY MANY Thanks to any who can steer me in the right direction!!!
Any and all help or direction would be seriously appreciated!